Calculating Performance in OEE
Key takeaways:
- Performance shows how efficiently equipment operates.
- It's calculated by comparing actual output to designed capacity.
- Minor stoppages, speed losses, and idle times affect performance.
Understanding performance in manufacturing
Performance, the second component of OEE, helps identify how effectively equipment is being utilized during production times.
Performance in OEE is calculated by comparing the actual output of the equipment with its designed capacity.
Performance efficiency takes into account the discrepancy between the ideal speed (aka validated maximum speed) based on the equipment’s design and its actual operating speed.
For a clearer understanding, let's visualize this with an example from a bottling line, where the actual units produced per minute are tracked against the theoretical maximum (validated speed).
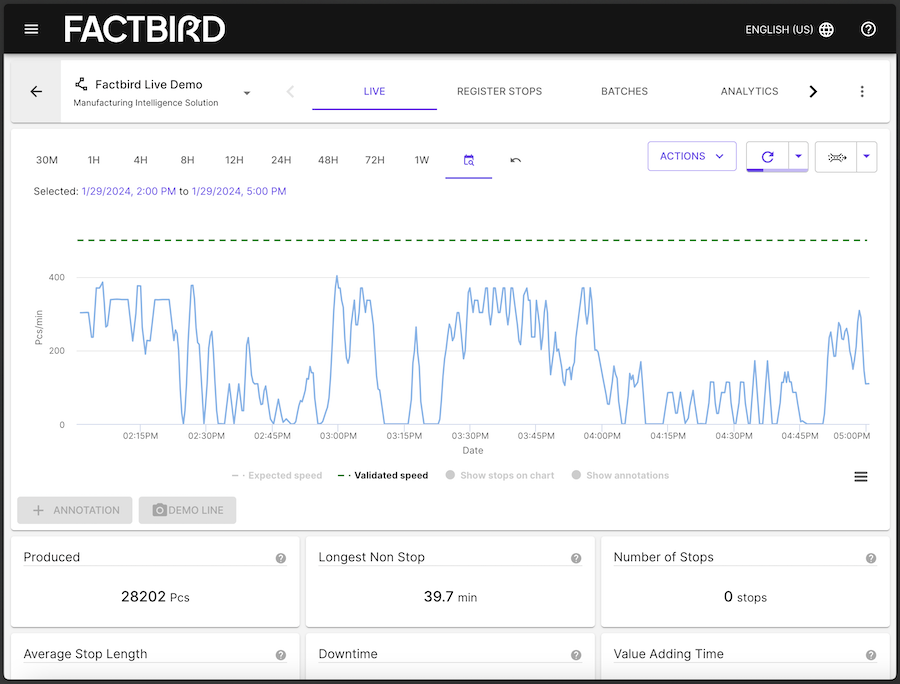
Understanding the gap between potential performance, which is the dashed line in the chart above, and the actual performance, which is the blue line, helps us identify areas that need improvement.
You can see in the live production graph that the blue line fluctuates between stopped and near peak.
The difference between the two lines is what we are interested in here.
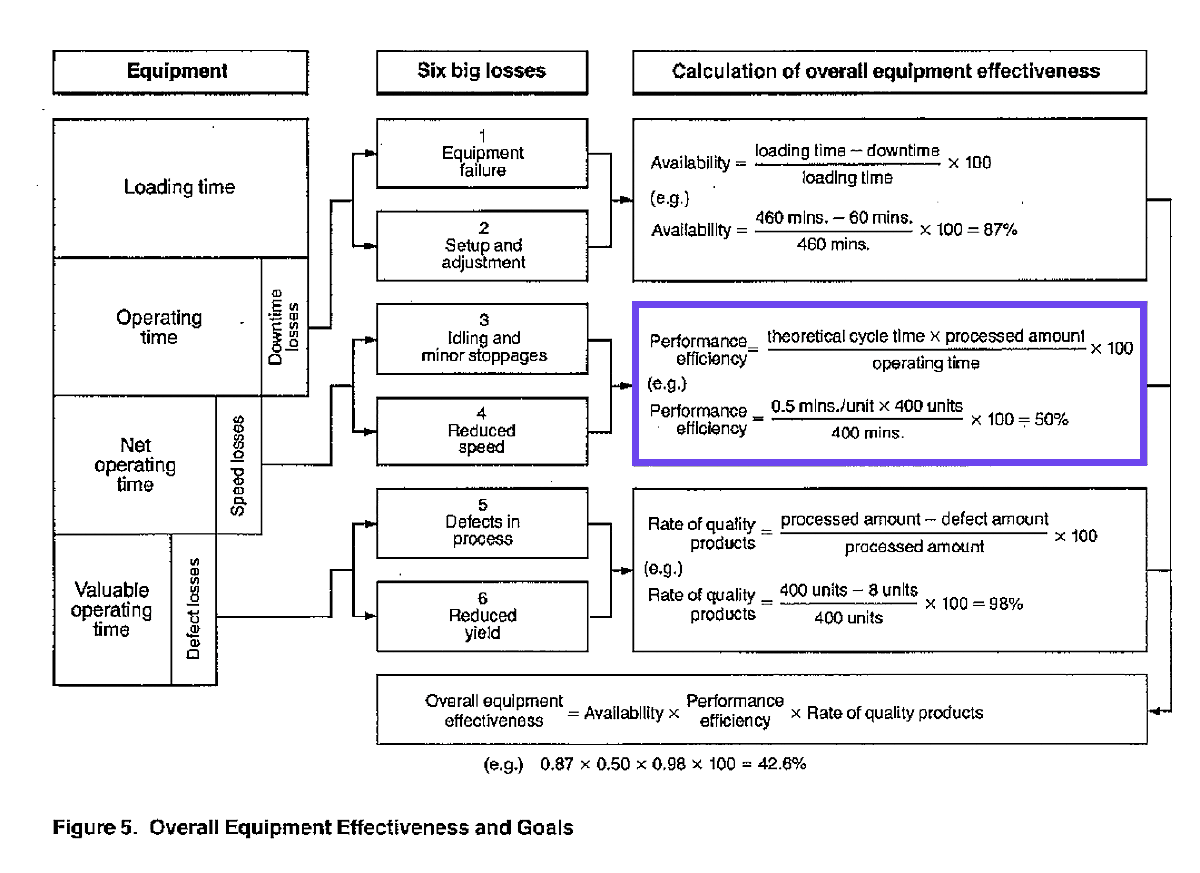
How to calculate OEE performance
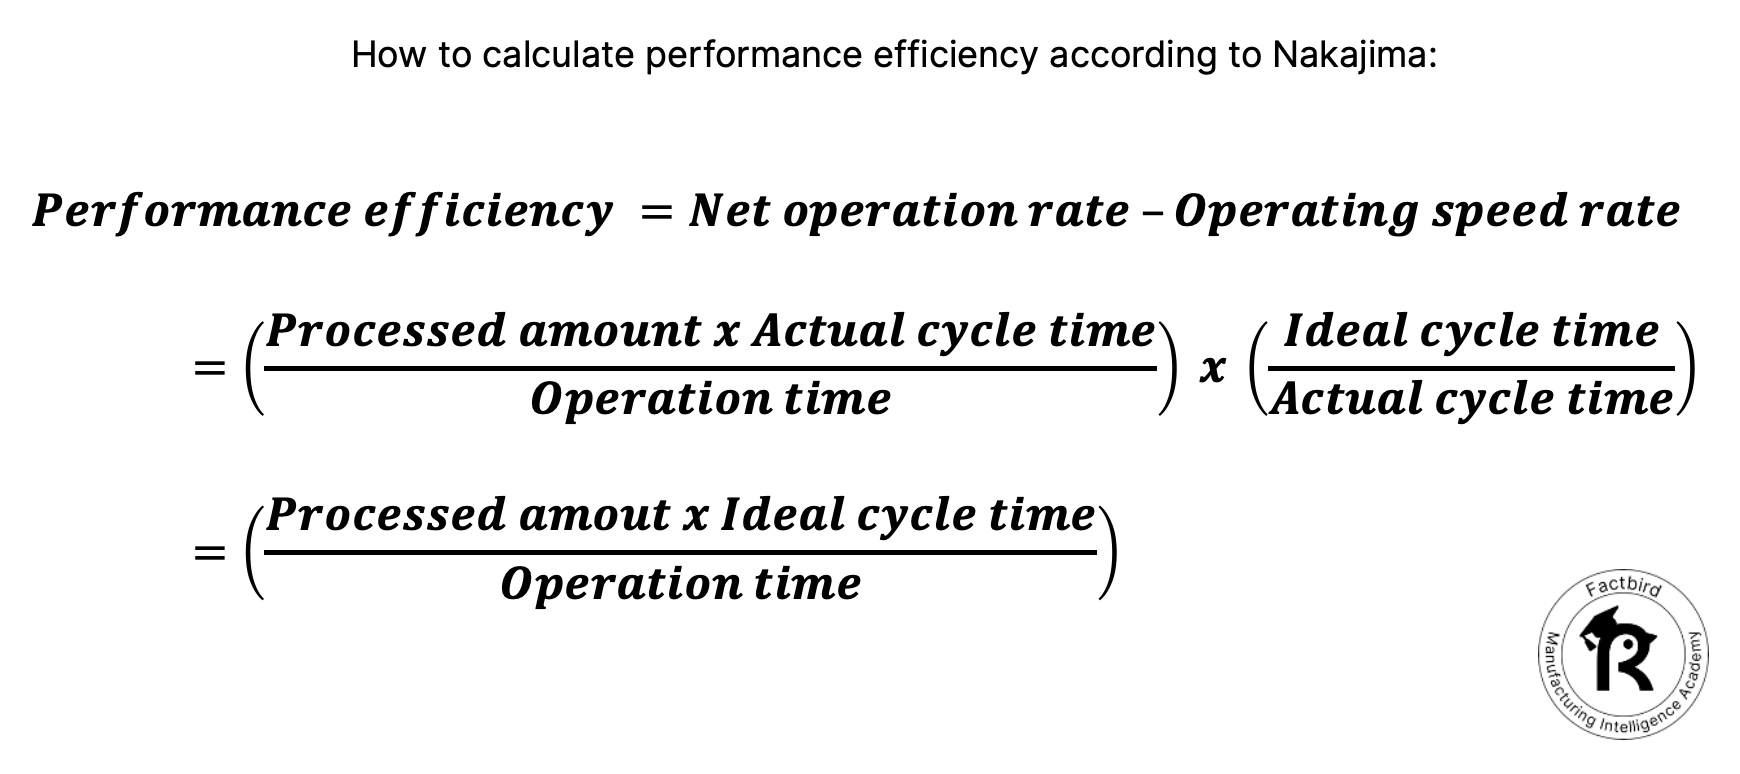
Here’s how to calculate the Performance efficiency according to Nakajima:
Performance efficiency =
Net operation rate - Operating speed rate
Where:
Net operation rate =
((Processed amount x Actual cycle time) / (Operation time))
And:
Operating speed rate =
(Ideal cycle time) / (Actual cycle time)
So, taking this knowledge, you can simplify the equation down so that Performance efficiency is just:
Performance efficiency =
((Processed amount x Ideal cycle time) / Operation time) x 100
Here's the full calculation to give you a clearer overview of what's going on:
This calculation will help you understand the percentage of the designed capacity that your equipment achieves during operation.
Ideal cycle time vs. Validated maximum speed
Please note, "Ideal Cycle Time" refers to the time it takes to produce one piece under ideal conditions. It is typically measured in minutes per piece or seconds per piece. A lower cycle time means faster production.
Example: If it takes 0.005 minutes per piece to produce under ideal conditions, the ideal cycle time is 0.0050.005.
"Validated Maximum Speed" refers to the maximum number of pieces produced per minute under ideal conditions, measured as pieces per minute.
Example: If the machine can ideally produce 200 pieces per minute, the validated maximum speed is 200 pieces/minute.
They have a reciprocal relationship, meaning Validated maximum speed = 1 / "Ideal cycle time"
[CTA]
Key factors affecting performance
Performance can be affected by:
Minor Stoppages: Brief stops in production, such as jams or quick adjustments.
Speed Losses: When machinery operates below its maximum capacity, causing a slower production rate.
Idle Times: Periods when the equipment is running but not producing, due to issues like material shortages.
Conclusion
In summary, measuring performance in OEE helps identify equipment efficiency and production bottlenecks.
Addressing factors like minor stoppages and speed losses improves overall productivity.
I hope this helps your understanding of how to calculate Performance in OEE. Join us in the next lesson where we take a look at Quality.