Introducing the Three Components of OEE
Key takeaways
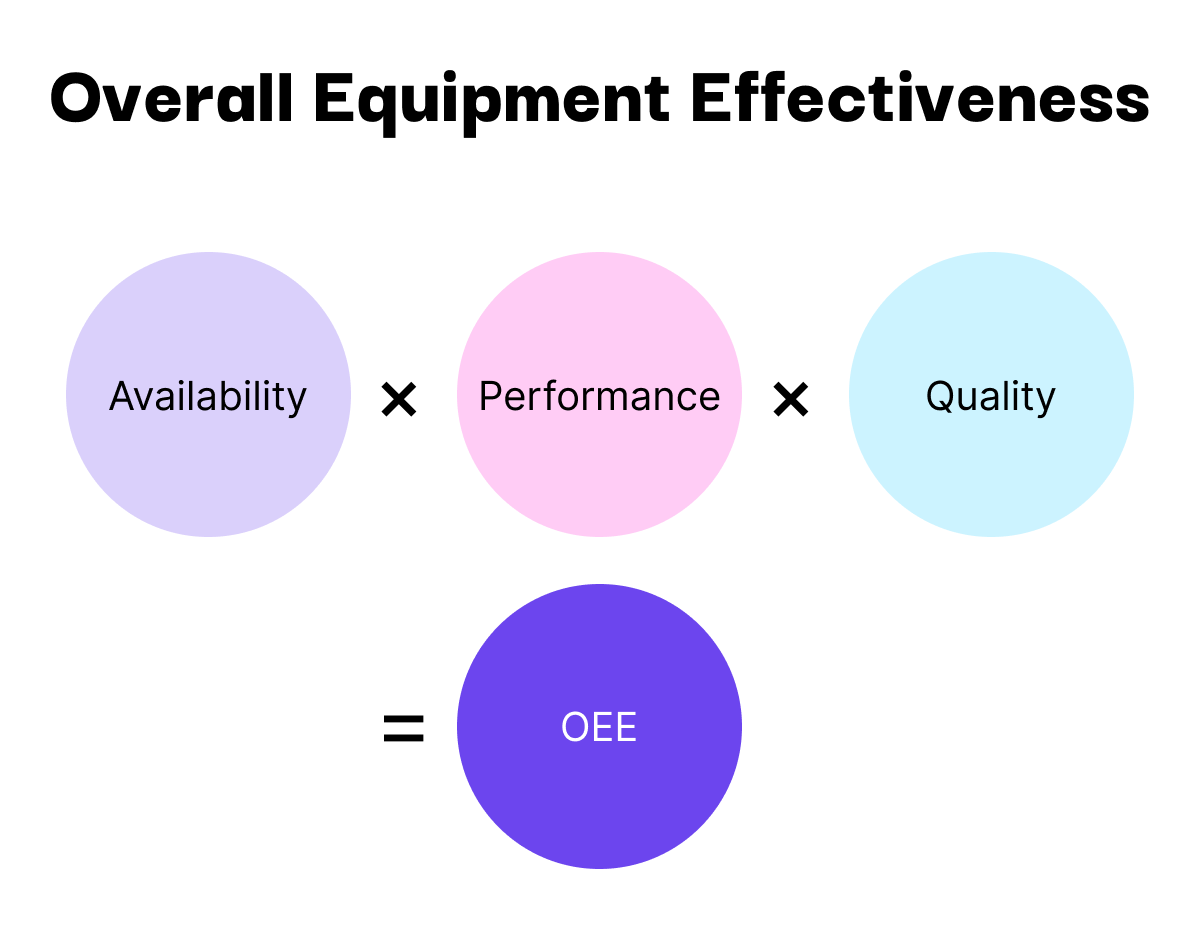
- OEE consists of availability, performance, and quality.
- Availability focuses on planned production time.
- Performance measures actual speed vs. designed capacity.
- Quality assesses good units against total production.
- All three components must be optimized for effective OEE.
What is OEE?
Overall Equipment Effectiveness (OEE) is a key performance metric in manufacturing that shows how effectively a site, production line, or machine is operating. It combines three components; availability, performance, and quality, into a single percentage score that reveals where productivity is lost. A perfect OEE score of 100% means you're producing only good parts, as fast as possible, with no downtime. By tracking OEE, you can identify inefficiencies, reduce waste, and improve output on the shop floor.
The three components of OEE
Let's now briefly look at the three components that make up OEE.
Availability
Availability focuses on the planned production time and how effectively it is utilized. Here, it’s important to ask how long the machine or system has been operating.
According to Nakajima, OEE considers downtime events that halt production, allowing an insight into overall operational availability. But this can differ between OEE calculation methods.
Performance
Performance measures the speed at which the manufacturing process operates compared to its maximum potential, or designed speed.
This component of OEE helps in identifying whether more products could potentially be produced during the allocated production time.
Quality
Quality assesses the number of products meeting the quality standards against the total number produced. Quality losses can include defects, rework, and scrap.
This component is crucial for understanding the waste generated due to defective products.
How the components of OEE interrelate
The three components of OEE each play a crucial role in the overall effectiveness of equipment.
Availability impacts the amount of time production can occur; Performance reflects the speed and efficiency of the production during this time; and Quality ensures that the output meets the required standards.
Improvement in any one of these areas can positively affect the overall OEE score, but true effectiveness is achieved when all three components are optimized in tandem.
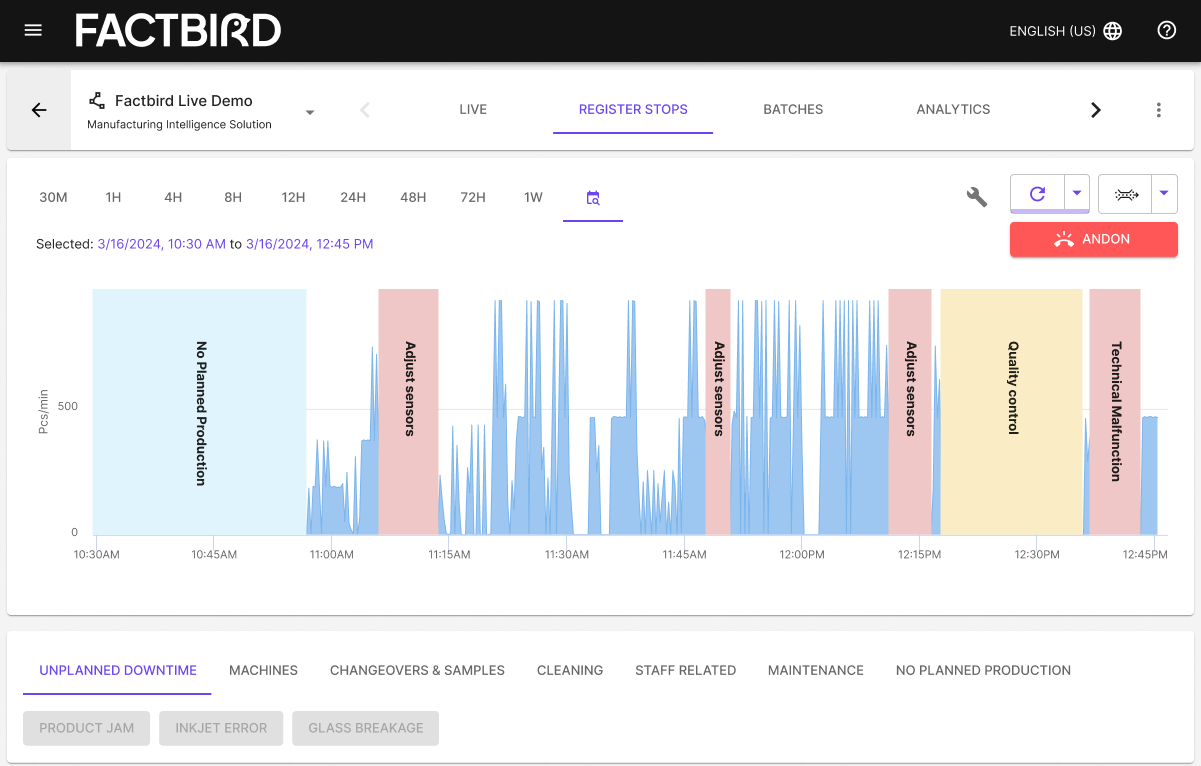
Availability is quite clear; increasing production time would improve OEE. You can see an example of non-planned production affecting bottles per minute produced in the image taken from the Factbird Cloud Application’s stop registration dashboard.
Increasing production speeds can help you produce more units.
But does your primary goal of more units conflict with your, say, secondary goal of reducing scrap and rework? Higher speeds can lead to higher quality losses and more breakdowns.
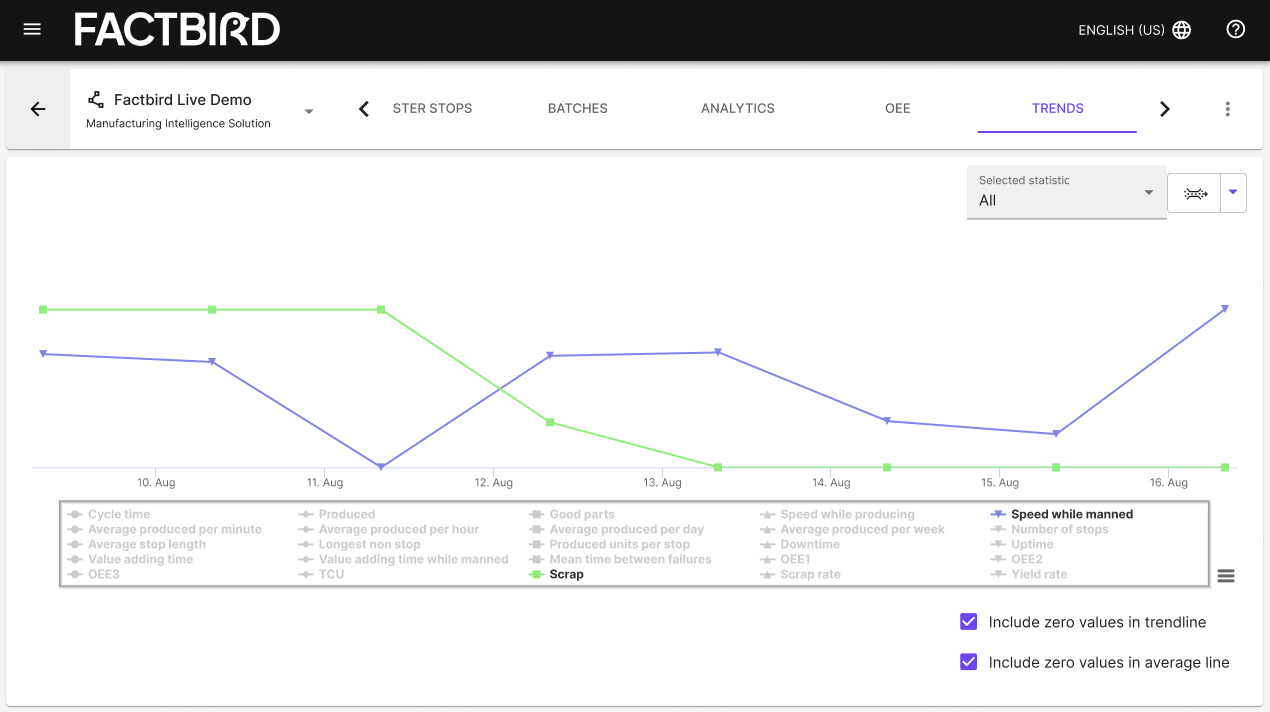
How do higher speeds affect scrap counts in this example? We would need to correlate the speed data to the scrap data and make a strategic decision about how much we want to focus on quality vs. speed and total output. Focusing solely on quality can lead to inefficiencies in production speed, and vice versa.
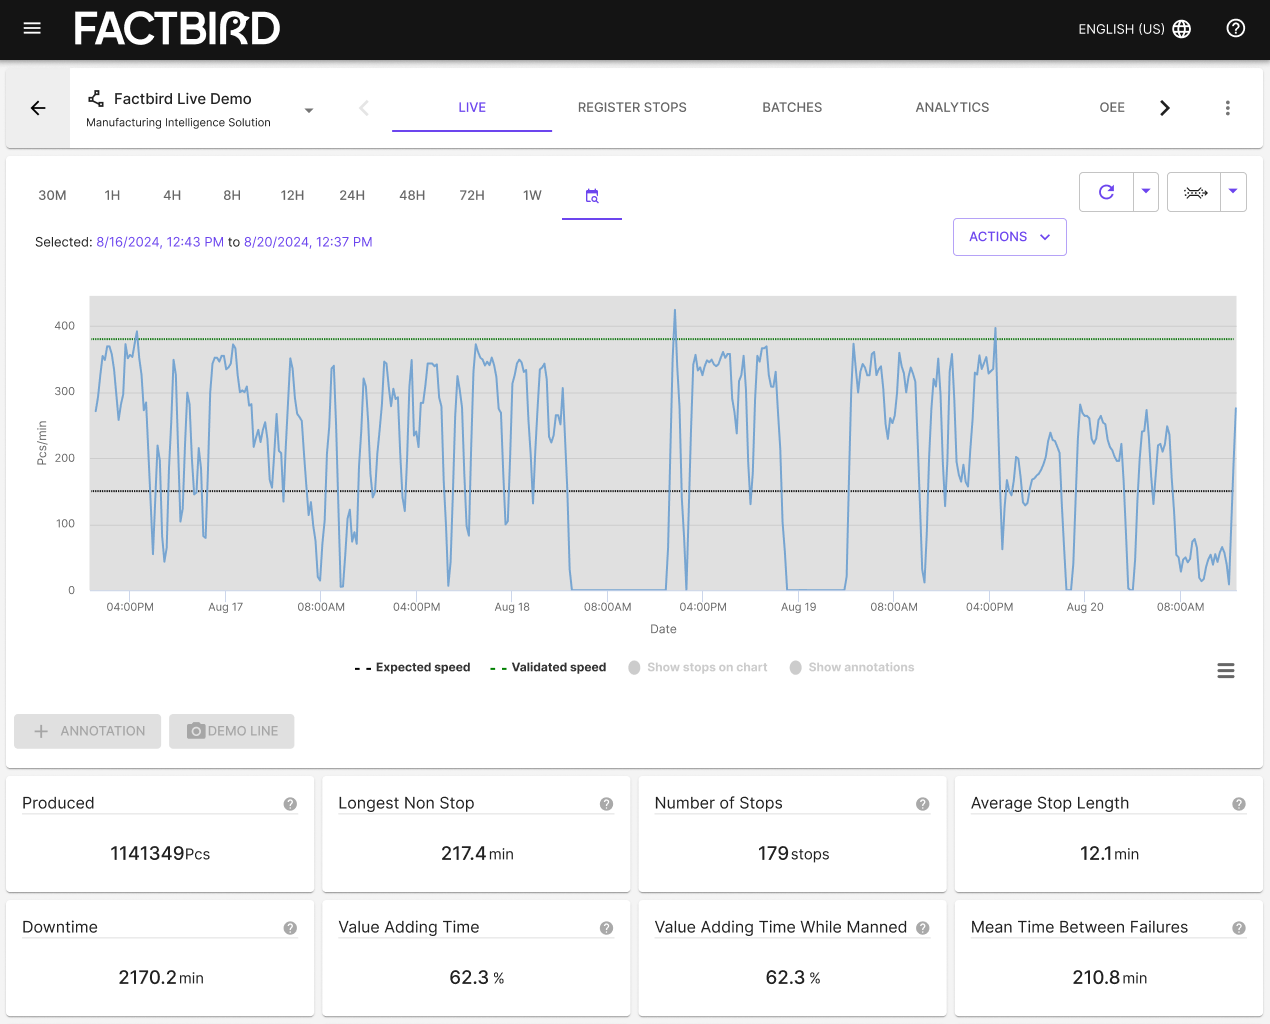
How about in this example? Would it make sense to turn up the production speed to produce at higher rates?
Without timely, accurate, and complete production data, it is very hard to make a smart, strategic decision.
By monitoring and improving each of the components of OEE using real-time data and OEE analysis software, you are more likely to achieve a more efficient, productive, and profitable manufacturing operation.
I hope this introduction to the components of OEE was helpful for you. That’s it for this the Introduction to OEE module. Next up, we will start to deep dive into Nakajima’s OEE calculation.